UNAIDS
Improving the acceptance of a high-volume data portal
UNAIDS had built a rich, comprehensive data portal to share global AIDS data — but users couldn't find what they needed. Research, heuristic evaluation, and a full redesign improved discoverability for non-specialist audiences without removing depth for experts.

Design Goals
Three outcomes that guided every decision
Something for every user who logs in — through progressive discovery. Moving away from the existing paradigm of designing only for people with domain knowledge.
Provide a better experience for users approaching the portal through different perspectives — education, analysis, legal, or financial — without forcing everyone through the same entry point.
Make the portal self-sufficient — reducing the volume of enquiries sent to staff asking for data that already exists on the portal but cannot be found.
My Role
What I did
Conducted a comprehensive heuristic review of the entire portal across web and mobile — surfacing more issues than the team was aware of, and generating the buy-in needed to proceed with a full redesign.
Structured qualitative interviews with internal stakeholders, staff, and external users — covering purpose, audience, report content, and areas of improvement. Documented and analysed for common patterns.
Distributed surveys to understand usage patterns across the diverse user base — identifying how different archetypes approached the portal and where they consistently failed to find what they needed.
Developed user personae mapped across four dimensions: tech-savviness, domain expertise, Excel expertise, and familiarity with peer sites (Jakob's Law). Identified the most frequent user archetypes as redesign priorities.
Translated research findings into a full redesign concept — from information architecture and navigation restructure through to high-fidelity visual design for a multi-section data portal.
The Problem
A rich portal that no one could navigate
UNAIDS had built a comprehensive data portal to make global AIDS data accessible to the world. The data was there — all of it, current and historical, across countries and topics. But users couldn't find it.
The staff were regularly receiving emails asking for specific datasets. They would search the portal themselves, find the data, and email back the results. The same portal. The same data. The staff had learned to navigate it; nobody else had.
Average session duration — despite a page load time of approximately 29 seconds
Time before mobile users abandoned the portal entirely
"Reduce the number of emails received by the staff — for which the portal needs to be extremely user friendly."
— Head of IT, UNAIDS
Challenges
Four structural problems with the existing portal
Different stakeholders had contributed different sections in different formats over time. The result was a portal with no visual or structural consistency — every section felt like a different product.
Data was available in two formats — one for analysts, one for strategists. The complexity of both made either format inaccessible to users without strong academic or domain backgrounds.
The portal had grown incrementally over time, and the navigation reflected that growth rather than any user mental model. Getting from one section to another was non-intuitive.
Content was not laid out to take advantage of available screen space, resulting in unnecessarily long scrolls and unintuitive section hierarchy — particularly severe on mobile.
Execution
Research that earned the right to redesign
Heuristic Evaluation

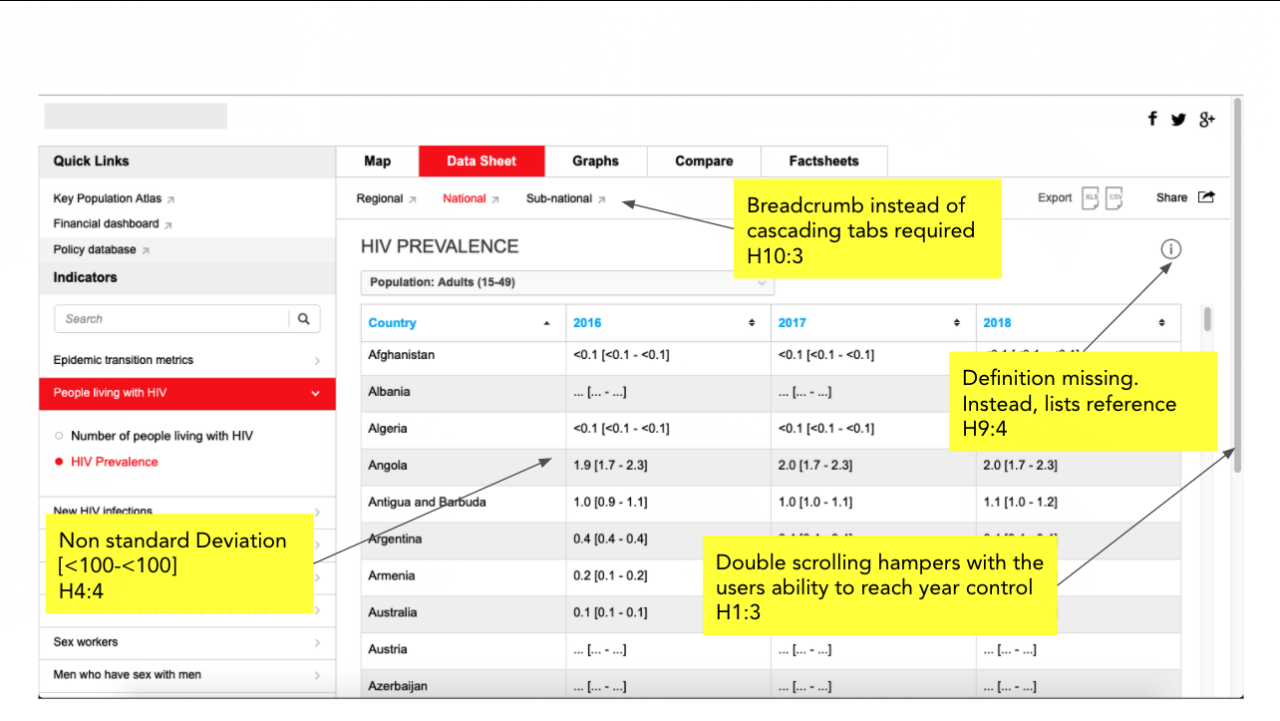
To initiate a redesign of this scale, stakeholder buy-in was essential. A comprehensive heuristic evaluation was conducted across the entire portal — web and mobile — producing a report card that surfaced more issues than the internal team was aware of. This report became the evidence base for the redesign brief.



Analytics
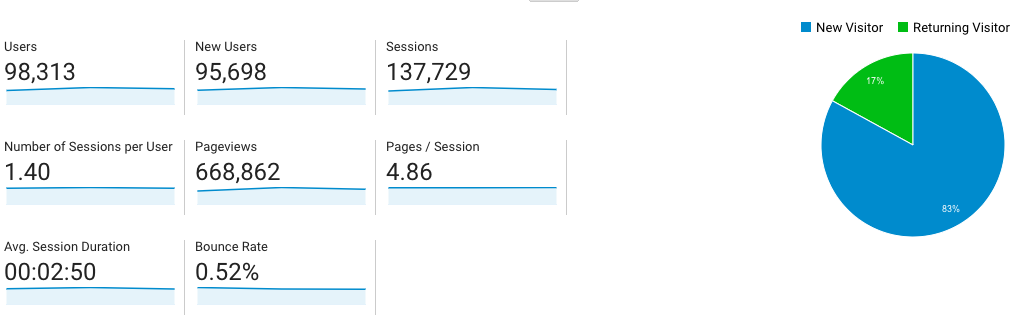
Google Analytics data was analysed alongside the heuristic report, identifying frequent visitor demographics, device distribution, and the critical session duration data that confirmed users were leaving within minutes of arrival.

Stakeholder Interviews
The qualitative interviews conducted for the stakeholders, internal users and external users, helped to identify a few common traits. following procedure was used for the same
Preparing the questionnaire
Getting the questions right is essential for the interview to succeed. A question guide was created to ensure that all the information required to be gathered is covered. The questions were categorized into three parts of 20 minutes each
Introduction
A few ice-breaking questions about the interviewees, their domain of expertise, what section of the data portal they are responsible for, and how long they have been doing this.
Purpose and audience
The questions were about the expected demographics of the ideal users and the stakeholders' contribution toward the section of the portal they were responsible for. This section also included ideas about what the new audience should be.
Report content
The questions in this section revolved around the content displayed on the portal, how that data was collected, how that data was structured, how to read/use the same and what needs to be included in the section to make it more usable and more aligned to the intended userbase.
Areas of improvements
Since the stakeholders receive a lot of emails regarding the content on the portal, they had ideas about what was working and what was not. So this section revolved around what they think needs to change/improve in their section. A few questions around success criteria were also included.
Conducting actual interviews
The stakeholders were identified and their profiles were analysed beforehand to tweak the questionnaire. The interview audio was recorded with the interviewees' consent so that during analysis, the entire data is available. Notes were also taken to ensure the emotions were captured. all the stakeholders also provided some documents which were helpful in further analysis.
Follow up emails
The recorded audio along with the follow-up questions were sent to the stakeholders to get further insights. These emails established a communication line in case I need further information.
Analysis of the interviews
The interview recordings and notes were 🔒 documented and were analyzed thoroughly to align the design process with the vision, expectations and personae. The documents were structured according to the structure of the interview questions to find common patterns across the answers provided by the stakeholders.
The purpose of the same was to extract key information and common patterns from all the interviews

Solution Framework
Two structural models emerged from the research synthesis and shaped the entire redesign concept.
Cascading Complexity Model
The entire data hierarchy was redesigned for progressive drill-downs — the surface showed simplified charts and graphs, accessible to anyone
Every visualisation was made interactive and shareable as a static image, lowering the barrier to engagement and enabling sharing without expertise
Users who wanted more depth could keep clicking "know more" — each level surfaced more complex datasets and visualisations, eventually reaching raw data for export to Excel
Visual consistency was maintained across all levels — the same charting language, colour palette, and layout patterns, regardless of complexity
Silos and Playground Model
Data was arranged in topic silos — each persona could find their relevant content without wading through data that was irrelevant to their domain
A "playground" was designed as a cross-silo space where users could pull data from multiple sections to generate combined, custom reports — catering to the most sophisticated analysts without cluttering the primary experience
Interactive Prototype
The full redesign concept was built in Figma as an interactive prototype — covering the homepage, topic silos, data visualisation views, and the comparison playground. The prototype below demonstrates the proposed navigation flow and information architecture.
Closing Thoughts
The data was never the problem.
UNAIDS had done the hard work of collecting and publishing comprehensive global AIDS data. The portal's failure wasn't about content — it was about the assumption that users would come with enough domain knowledge to find what they needed. They didn't.
The heuristic evaluation was the pivotal moment: it produced evidence that gave the organisation permission to change something they had spent years building. Once the research was in hand, every design decision had a clear rationale behind it — not taste, but user behaviour data and stated stakeholder goals.
This was a contracted engagement for UNAIDS. The heuristic evaluation report and interview documentation are confidential and not included in this case study.